
The following Pie-Charts show the percentage of different categories (A, B, C, D, E and F) of employees in a company in the year 2019 and 2020. The total number of employees was 4000 in 2019 and 5000 in 2020.
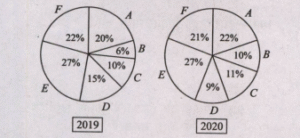
In which one of the following categories of employees, the percentage change in number of employees in 2020 was maximum as compared to 2019?
Mathematics
2021
CDS Elementary Mathematics 2021
CDS 2021
Options
Similar Questions
Two dice each numbered from 1 to 6 are thrown together. Let A and B…
Two dice each numbered from 1 to 6 are thrown together. Let A and B…
An urn contains one black ball and one green ball. A second urn contains one…
An urn contains one black ball and one green ball. A second urn contains one…
What is the most probable number of successes in 10 trials with probability of success…