
The following Pie-Chart-I shows the people migrating to Delhi from different Indian States (P, Q and R are three different States and S is the combined group of other States) and Pie-Chart-II indicates the different age groups A, B, C and D of these migrating people for each State.
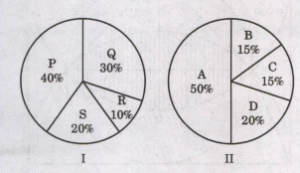
If the people coming from a particular State belonging to S are 15% and 24,000 in number, then what is the total number of migrating people belonging to the age group B ?
Options
Similar Questions
Two dice each numbered from 1 to 6 are thrown together. Let A and B…
Two dice each numbered from 1 to 6 are thrown together. Let A and B…
An urn contains one black ball and one green ball. A second urn contains one…
An urn contains one black ball and one green ball. A second urn contains one…
What is the most probable number of successes in 10 trials with probability of success…