
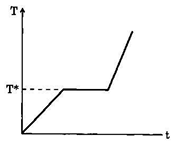
The figure given above shows the temperature (T) – time (t) plot when we start heating a piece of naphthalene. The temperature (T*) at the plateau of the curve signifies
General Ability
2013
NDA General Ability 2013
NDA 2013
Options
Similar Questions
‘Operation Cactus’ is the name given to Indian Military intervention in
Prof. Vijay Raghavan, an Indian scientist, who has been elected Fellow of Royal Society in…
The UN has recently passed a resolution against human right violation in a South Asian…
A high level committee set up by the Ministry of Housing and Urban Poverty Alleviation…
Suppose, the Naxalites have kidnapped a Deputy Commissioner from Baster region in Chhattisgarh and taken…