
Average hourly earnings per year (E) of the workers in a firm are represented in figures A and B as follows :
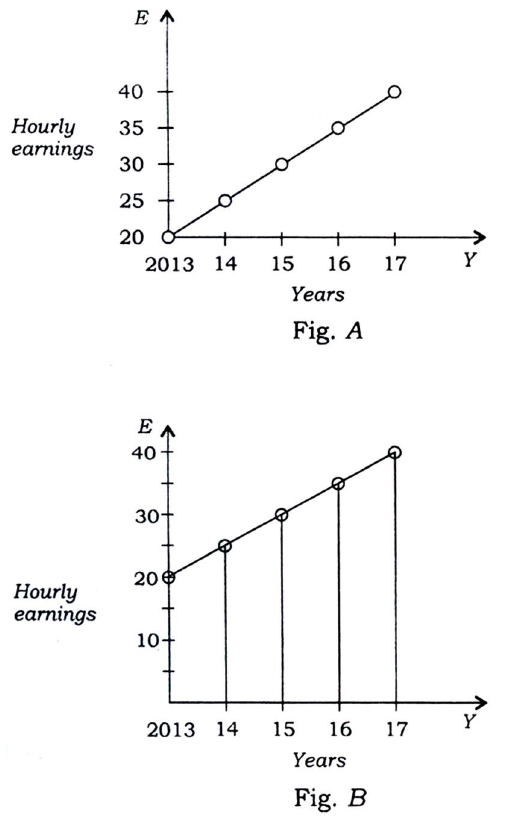
From the figures, it is observed that the
CSAT
2018
Options
Similar Questions
Consider the following figures: In the figures (I) to (VI) above, some parts are shown…
Consider the figures given below To fit the question mark, the correct answer is:
Study the graph and answer the item given below.
Cynthia’s knees were quaking because
The author prefers government as the umpire and private sector as players because